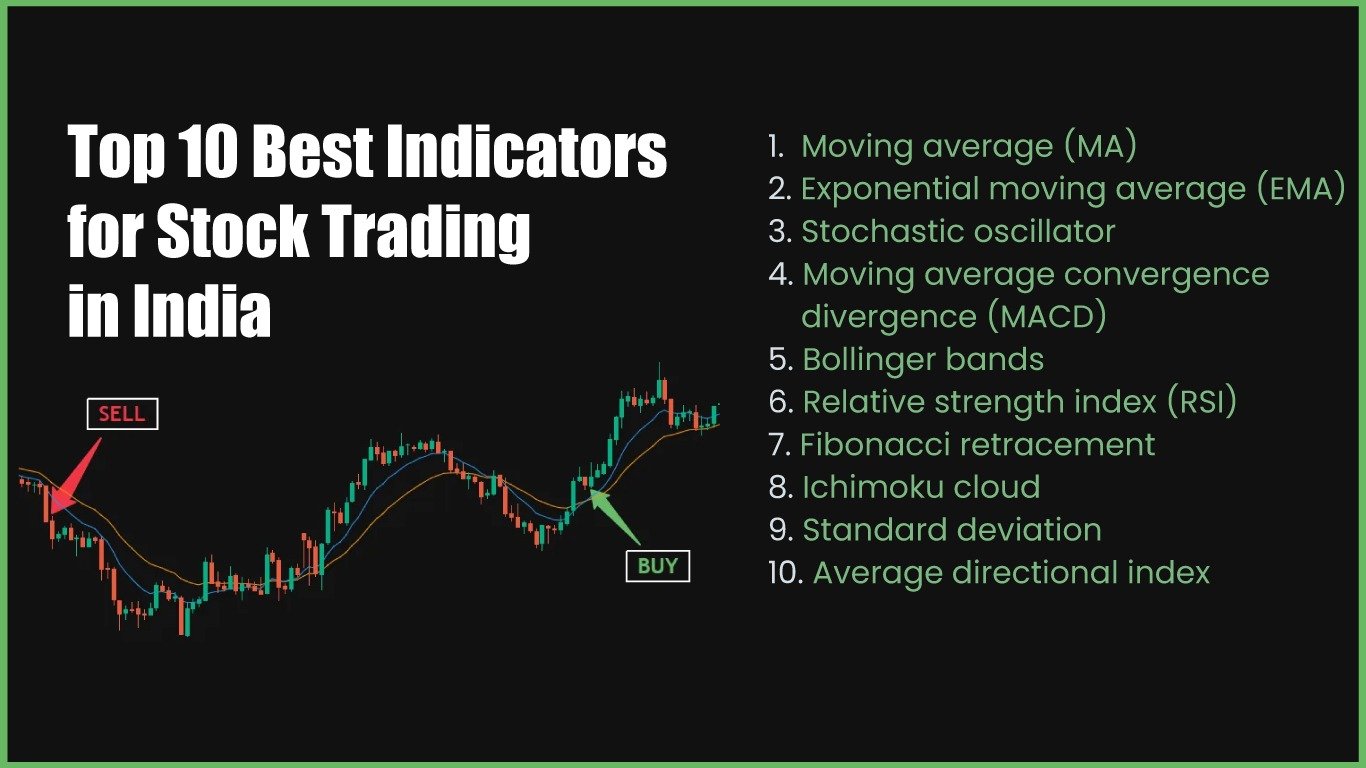
Top 10 Best Indicators for Stock Trading in India
Stock trading is an exciting way to grow your money. Many people in India have started trading in stocks, but not everyone makes profits. To become a smart trader, you need to know how to read the market. One of the best ways is by using indicators. Indicators help you understand whether it is a good time to buy or sell a stock.
In this blog, we will explain 10 important indicators every Indian trader should know. We will keep it simple so that even beginners can understand and use them.
1. Moving Average (MA)
What it means:
A moving average shows the average price of a stock over a certain number of days. For example, a 50-day moving average shows the average price for the last 50 days.
How to use:
When the stock price goes above the moving average, it is usually a sign to buy. When the price falls below it, it can be a sign to sell.
Tip:
Popular moving averages are the 50-day and the 200-day moving average.
2. Relative Strength Index (RSI)
What it means:
RSI tells you if a stock is overbought (too expensive) or oversold (too cheap). It is a number between 0 and 100.
How to use:
- If RSI is above 70, the stock might be overbought. It may fall soon.
- If RSI is below 30, the stock might be oversold. It may rise soon.
Tip:
Check RSI along with other indicators before buying or selling.
3. Bollinger Bands
What it means:
Bollinger Bands show how much a stock price moves around its average price. It has three lines: the middle one is the moving average, and the upper and lower bands show the range.
How to use:
When the bands are wide, the stock is more volatile. If the price touches the upper band, it may fall back. If it touches the lower band, it may go up.
Tip:
Bollinger Bands are great for spotting sudden price breakouts.
4. MACD (Moving Average Convergence Divergence)
What it means:
MACD is a trend-following indicator. It shows the relationship between two moving averages.
How to use:
- When the MACD line crosses above the signal line, it’s a buy sign.
- When the MACD line crosses below the signal line, it’s a sell sign.
Tip:
MACD works well for short-term and medium-term trading.
5. Volume
What it means:
Volume shows how many shares were traded in a day.
How to use:
High volume means strong interest in the stock. When price goes up with high volume, the trend is strong. If price moves without volume, the trend is weak.
Tip:
Always check volume before trading. It confirms whether the trend is real.
6. Stochastic Oscillator
What it means:
This indicator compares the closing price to a range of prices over time.
How to use:
- If the value is above 80, the stock may be overbought.
- If it is below 20, the stock may be oversold.
Tip:
Use it with RSI for better signals.
7. Support and Resistance Levels
What it means:
Support is the price level where a stock usually stops falling. Resistance is the price level where a stock usually stops rising.
How to use:
Buy near support and sell near resistance. These levels help you set entry and exit points.
Tip:
Support and resistance are easy to draw on a price chart. Practice spotting them.
8. Moving Average Crossovers
What it means:
This method uses two moving averages of different periods.
How to use:
- A “Golden Cross” happens when a short-term MA (like 50-day) crosses above a long-term MA (like 200-day). It’s a bullish signal.
- A “Death Cross” happens when a short-term MA crosses below a long-term MA. It’s a bearish signal.
Tip:
Crossovers help identify trend changes.
9. Average True Range (ATR)
What it means:
ATR measures how much a stock moves, on average, in a day.
How to use:
Higher ATR means higher volatility. It helps you decide stop-loss levels.
Tip:
If you don’t like too much risk, pick stocks with lower ATR.
10. Fibonacci Retracement
What it means:
This tool helps find possible support and resistance levels based on the Fibonacci sequence.
How to use:
Traders draw Fibonacci levels on a chart to see where prices might bounce back.
Tip:
Use it with trend indicators for better accuracy.
Final Words
Indicators are very helpful for making better trading decisions, but they are not magic. They help you read what is happening in the market. Always remember:
- Use more than one indicator together.
- Follow market news and company results.
- Keep a stop-loss to control losses.
- Never invest all your money in one stock.
In India, many traders use these indicators daily. If you learn how to use them, you will become more confident and trade smarter. Start by picking 2 or 3 indicators and practice with them. Over time, you will know which ones work best for you.
Happy Trading!
Disclaimer
Stock trading has risks. This blog is for learning only. Please do your own research or talk to a financial advisor before investing your money.
